Dogs Industry long term online search trends Australia, America, UK - 2
We looked at the total ‘dog associated’ search market on Google in each country (all terms collated) and compared search volume trends for 2010 as well as the specific terms that people searched for about dogs. It was found that the term ‘DOGS’ is the most searched term in Australia and America and second in the UK (first was their RSPCA equivalent).
While this analysis is very useful for understanding patterns of how people search, Google data for this macro level only provides data for up to a maximum of twelve months. To better understand the health of the dog market, it is useful to analyse long term season dog search trends. The only limitation with this is that Google provides data in its relative growth database, as one term at a time, so the most obvious term to compare across countries is the generic leading search volume term ‘Dogs’.
One more caveat on this data is that Google provides its growth rate data as compared to the whole search market, rather than values in absolute terms, or even in growth relative to the Dogs term itself. This means that a flat growth dog search trend (for the relative data set) ONLY indicates that peoples’ interest in searches for dogs is at the same level as their interest in all other search terms, which as we know is growing every year.
Australia ‘DOGS’ search term trend
The following graph shows how the term “dogs’ has been performing in terms of search volumes on Google in Australia, relative to all search volumes in Australia. It includes all languages and all states, which is a good baseline for comparison with other countries.
What you will first notice is that there is a fairly strong seasonal trend. The start and the end of the year (summer) appears to be the highest search volume with an alternating up and down pattern in the middle of the year. The black line is the five year average, and it shows mini peaks in April, July and September.
What you will also notice is that since all the data for each year is tied or normalised to January ( value = 1) and this is one of the highest volume months, then the majority of the other months have a growth value of less than one. Also notice that the total band of growth for all five years tends to only fluctuate between 1 and 0.85 (a 15% variation in seasonal search volumes) or interest in dog information online is fairly constant (assuming that on average, all other search trend seasonality is approximately even throughout the year).
And here is one of the largest unknowns in the mix: because of the way that Google ties this information to the total search market, it cannot easily tell you how the dog market is growing itself. For that information you need to look at absolute volume trends as shown in the previous Dogs online market article. For instance, looking at the graph below, you might be tempted to consider that the online dog market in Australia was flat. Each year it seemingly starts on a peak then drops below this peak for the entire year until December (anyone for a Dog Christmas present?)

HOWEVER, the previous dog online market article shows that over 2010, the dog online market had been growing very well. For the top 365 'dog associated' terms searched on Google in Australia, the volume of searches had started in January near 200,000 and grown fairly steadily to near 260,000 searches in August.
We know that the total market is growing at a high rate in absolute terms and the apparent ‘flat’ growth rate (relative market data) for the ‘dogs’ term in the graph above, when measured against a fast growing total market, means that in absolute terms that the dog market is growing just as fast as the total fast growing search market.
Other reasons that the total Google search market is expanding is that Australia’s population has been increasing, the market share of the Google search engine has been increasing, internet penetration has increased (people with access to computers) and overall usage per person has increased.
Australia Dog market ABSOLUTE data growth versus RELATIVE growth
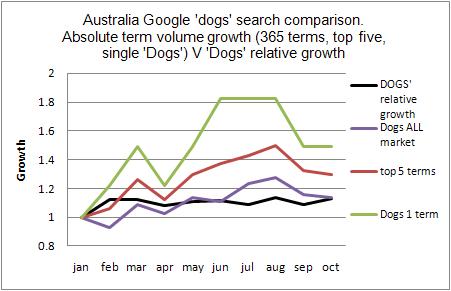
In light of the above explanation about the Google relative data base information, the following graph should not be surprising. The black line above (average relative growth of Dogs market) is shown on the graph below in black. It is compared against the ABSOLUTE data growth of: The total dogs market, the top five dog associated terms and the single ‘Dogs’ term.
As you can see, after a rise in February, the black relative growth line appears very flat by comparison with the highest growth term (actually the same term ‘Dogs’ in green). The graph also shows that the single term Dogs is growing much faster than either the top five terms combined (maroon) or the market as a whole (purple). This means that in Australia, in terms of the total dog market over 2010, people were putting more faith in entering a single generic word term into the search engine to find what they want, rather than multiple terms.

Australia ‘Dogs’ single term ABSOLUTE growth V ‘dogs’ relative growth x 5.5
The graph below compares the growth of the ‘Dogs’ term on Google in Australia in terms of absolute growth (purple) and relative data set growth (black). This graph was created by multiplying the relative data set values by 5.5 so direct comparisons in shape is possible.
Both data sets are for the same time period in 2010. The main differences in data are that the Absolute (purple) term uses monthly data while the relative Dogs growth line (black) uses weekly data, averaged into a monthly value. You can see that the two graphs look fairly similar, as they should be since they are based on the same term ‘DOGS’. It is just that the black ‘Dogs’ growth is relative to the total search market and any seasonal fluctuations in that will also affect the black relative data line.
You will also see that the relative (Black) line has more fluctuations than the purple. Because of the sheer size and complexity in the total search market, it is likely that any of the major fluctuations are actual changes in search volumes associated directly to the ‘dogs’ search term.
You will also notice that changes in relative growth data (black line) tend to occur first. This suggests that while the absolute data line (purple) provides information on absolute volume search trends, that the relative data line (black) is more accurate in BOTH showing change (see that data does not change for absolute data between June July and August) and the time of change (note absolute data lags changes in relative data by a month or so). This shows that the relative dog graphs are extremely useful in uncovering short term trends as well as long term seasonal trends. All you need to do is multiply the relative data set by the right value to transform it into an absolute volume proxy – if you need to know real world search volumes for a particular term, such as ‘dogs’.

America Dogs relative trend 2006 – 2010
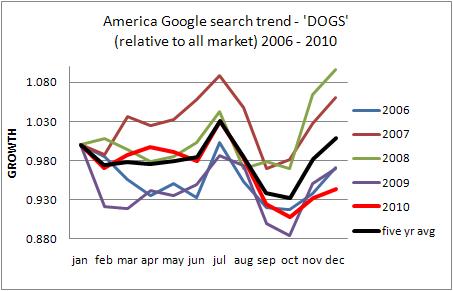
The American relative growth trend graph (below), again shows striking seasonality over five years. However it has quite a different pattern than shown in the Australian search habits graph.
For the ‘Dogs’ search volumes in America again on this relative data graph, the average growth rate appears to be near zero. This means that in absolute terms, ‘dogs’ searches are growing at a relative high rate equal to the total Google market searches. The seasonal pattern as seen by the black five yr average line shows a flat rate (except for 2007) from January to June, when it reaches a peak in July (middle of summer) before hitting a 6% trough in September and October, before reaching parity in December again (the Christmas present effect).

America ‘Dogs’ absolute volume growth Feb Nov 2010
How does the absolute search volume trend for 'Dogs' (black line below) compare to the 2010 relative 'dogs' growth graph above (red line)? That is, we are comparing the exact same term ‘dogs’, just that one data set is from Google’s absolute database and one from its relative growth database. The ‘Dogs’ relative growth trend for 2010 (red line above) holds flat until June as does the absolute graph below. The relative graph then has a peak in July before a steep decline to Sep / October. The absolute graph below has a slight delay in its peak until September October then begins a decline in November.
The completely flat absolute search volume data in the graph below for Feb to May and the ‘delay’ in following the relative Dog market growth pattern above (which is based on weekly data) suggests that again, the relative Dog search trend data, like for Australia, is more accurate and timely, than absolute data set information.

America comparison of ABSOLUTE search volume trends ‘Dogs’ single term V Dogs all market (621 terms)
You can see from the graph below that Google approximates single term absolute volumes in its data set (the black line is very blocky, and data doesn’t change for every month).
As the single term ‘Dogs’ needed to be multiplied by 9 to approximate the volume of the total dog associated search market (621 terms) shows that this single term ‘dogs’ represents near 10% of the ‘dog associated’ search market in America.

UK dogs market seasonal trends 2010
The graph below shows the very strong correlation between the last five years of Dogs search volumes in the UK. The search pattern at first glance may appear similar to the US, but there are striking differences. In the UK search growth has been shown to plummet every year from Jan to a trough in May June followed almost always by a peak in August (slightly delayed on the US peak in July). However from here the differences really show up.
In the US while growth declines until Sep/ Oct ALWAYS increases again in December – and on average, to a very similar level as January. HOWEVER in the UK after the peak in August search growth just continues to decline every year until the years equal lowest growth value in December. The five year average December growth value is near 12% below the start of the year. Meaning that for five years the UK (the leading dog market globally on a per capita basis) has been in decline relative to the complete Google search market in the UK.

UK absolute growth of total DOGS online market 2010
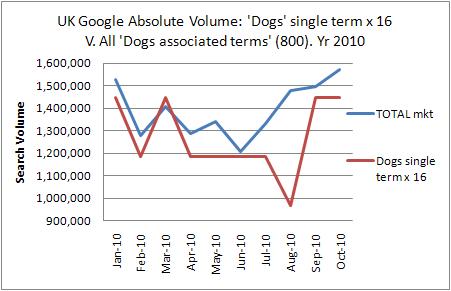
The synopsis gained from the above relative graph for ‘dogs’ suggests that the UK dogs market might be in decline, or at least relative to the total search market. Below is the absolute volumes for the single dogs term ( times 16) and the total ‘dogs associated’ market (blue line) of 800 UK search dog associate terms.
The single ‘dogs’ term is multiplied by 16 to be close to the total UK market meaning that it is a much lower percentage of the total market than the term ‘dogs’ is in the US market (near 10%). Thus the UK market is more diverse (longer tail) with more refined search terms. You will also notice that while both the relative dogs volumes (black line above) and absolute dogs volumes (red line below) both decline until June/ July, that the dogs absolute volumes show a rapid upswing in searches in September and October.
Both the single term ‘dogs’ and the total ‘dogs associated’ market after much fluctuation in the middle of the year reach October at a similar absolute search volume as they started the year. This suggests that if the UK has a strong growth at Christmas time (as the dogs market have in America and Australia) then it too will finish the year with positive growth in terms of absolute search numbers. If this happens, what this is telling us about the relative growth market is that its ‘apparent decline’ is just due to it not growing as fast as the rest of the Google searches in the UK, not that the interest in dog information is in decline itself.
This is a very good thing for the UK as a decline in online searches would highlight a decline in general with dogs in the real world in the UK. With so many breeds having their origin in the UK, a strong UK online dog market suggests that these breeds will be able to keep healthy numbers at their source which will hopefully ensure diversity in breeding stock and healthy pure breeds to come.

CONCLUSIONS
For Australia in 2010, the Single term ‘dogs’ is growing faster than the top five terms and the total ‘Dogs associated’ market of 365 terms. The relative ‘dogs’ search growth over five years shows strong positive seasonality in summer (Jan and December) – potentially from Christmas purchases. While the analysis of the “dogs” relative term growth appeared flat, this is only because it is compared to the total search market which is growing fast.
A comparison of the same term ‘dogs’ from different Australian data sets (keyword tools and Google trends) suggests that Google trends data is much more refined (accurate) and that the Absolute database has a potential lag in data reporting of at least one month.
In America, a very different five year relative growth trend was shown for the term ‘dogs’. It shows that while there was much volatility in the five years up to May, that every year had a peak in July (middle of summer) and a trough in September/ October, before rising to a peak again in December (Christmas purchases).
The UK relative growth dogs market shows a decline of 12% per year on average over the last five years. This would be alarming for one of the highest per capita dog search countries and the origin of so many breeds – except that this data compares dog searches to total market searches. In absolute search terms, the interest in dogs still suggests positive growth. While the volume data finishes in October 2010 (time lag with Google releasing data), it does show that by October that the absolute volumes are on an upswing and at least similar to the jan 2010 value.
This article shows how it is useful to view the relative and absolute dog online search market trends for the leading countries to have an indication of seasonal trends and the general well being of the dog industry. A healthy ongoing growth in total dog associated searches (all terms associated with the seed term dog) suggests a healthy ongoing interest in dogs globally – or at least the major developed countries. Strong information searches (over the last five years), at least in parity with the fast growing Google search markets, suggest a continuing interest in dogs, and dog welfare. This is particular witnessed in the UK where the leading term is ‘dogs trust’ a UK equivalent of the Australian RSPCA (dog welfare society).
Original research & Analysis by Bruce Dwyer. If you wish to use any of this information please refer to the article as a reference and provide a live link to http://www.dogwalkersmelbourne.com.au


